Last year, the 2020 census was held across the country, giving us greater detail on the growing size and diversity of our nation. The census calculated that Texas was the fastest growing in the country, with 4 million new residents since 2010. With all this growth, Texas is set to gain 2 new congressional seats for the 2022 midterms, the most seats gained by any state from this census. Everything is bigger in Texas.
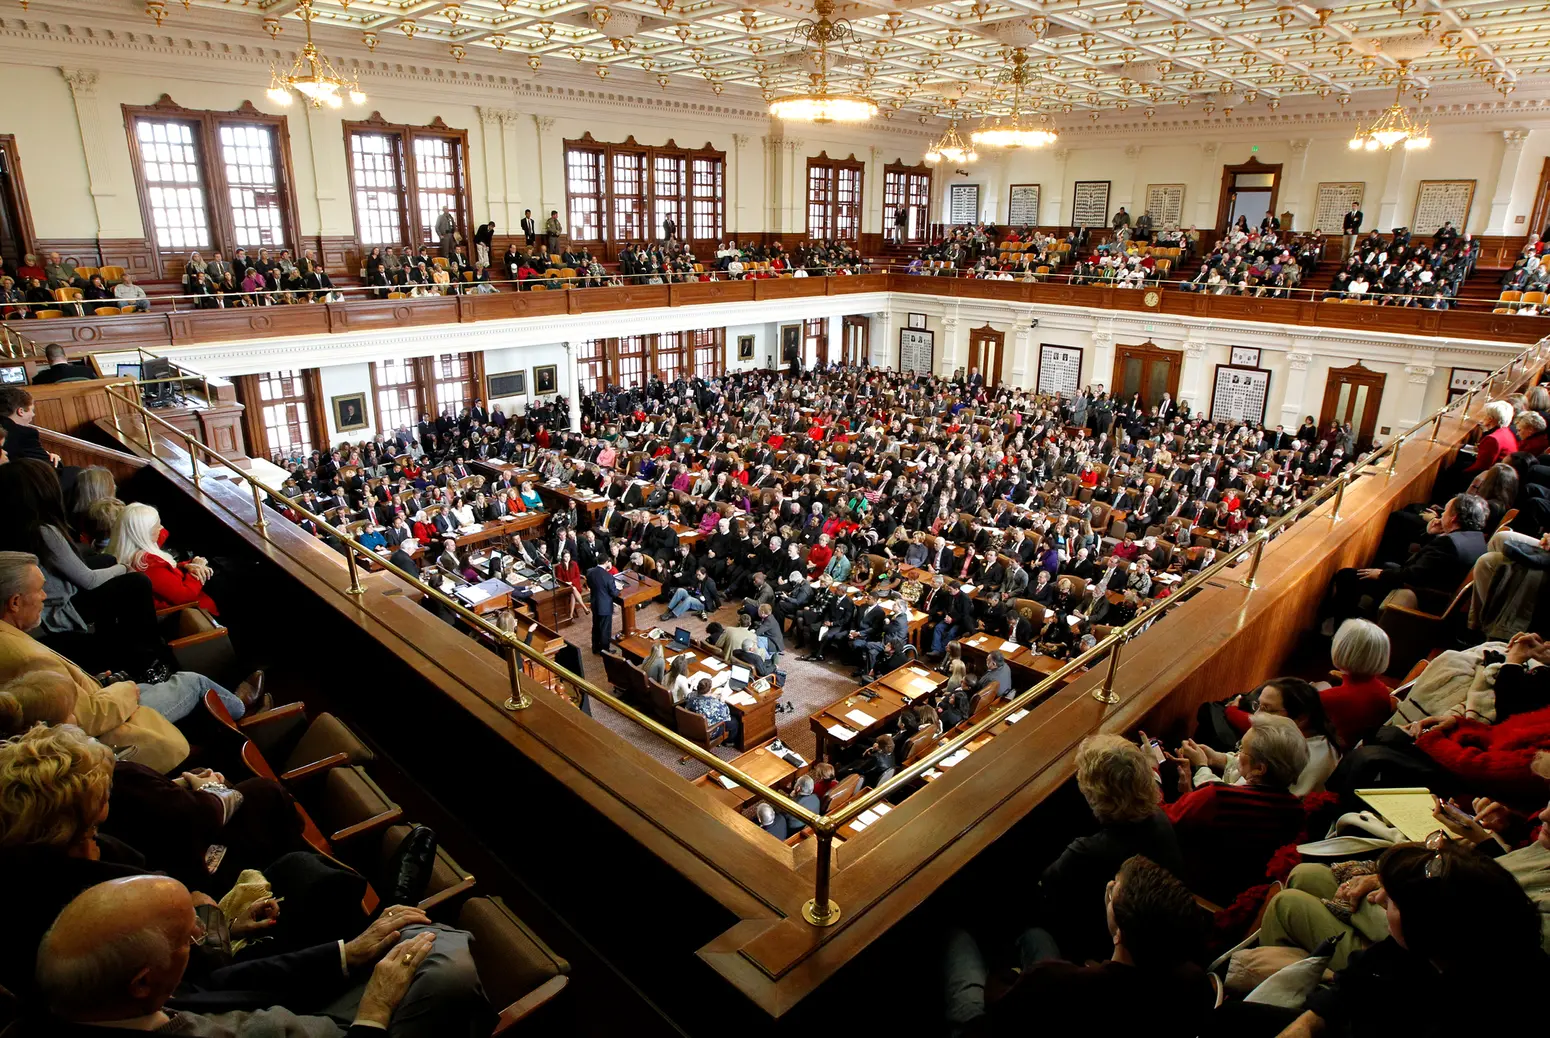
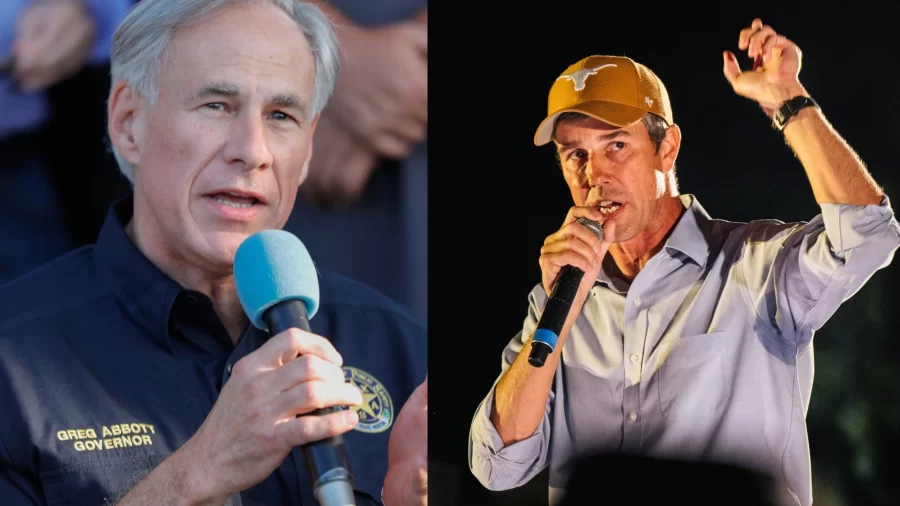
Now, this is all well and good, but some trouble arose when the politicians got hold of this information. To mirror the growth shown in the 2020 census, politicians drew and redrew the new voting districts that will be in place for the next decade. These new maps were approved by the state legislature, and on Oct. 25th Governor Greg Abbott signed them into law. But in all this hard work, they seemed to have missed a significant detail. Of the 4 million new residents, 2 million were Hispanic residents. In fact, 95% of the population growth was people of color (POC). But where were the two new districts? One is in the Austin area and the other in Houston, and both have a predominately white population. Strange.
That’s not all though. Not only did these two new districts not properly represent the growth in diversity, they actually downplayed previous population demographics, because Hispanic districts dropped from 8 to 7, and the only black district in the state has been lost. In case you were wondering, 23 of the 38 districts have a white majority. White majority districts control 60% of Texas’ congressional seats, while only making up 39.75% of the state (0.24% higher than Hispanic citizens). The same goes for the State House– also at 60%. The State Senate is the only one to not follow the trend, going from 21 to 20 out of the 31 seats. But even that’s still 64%.
Now, when asked about these odd numbers, the Republican politicians who drew these maps said they were made “color blind”. Based on how some of these maps are drawn, they might have drawn them fully blind. Long arms reach out in jagged patterns and then burst into big centers that make absolutely no sense. Communities with no ties to each other are now all lumped into districts. District maps are usually oddly-shaped, but these are so egregious that the Department of Justice has sued Texas over its gerrymandering and new election laws violating the federal Voting Rights Act and diluting the Hispanic voting power.
If you can’t tell what I think, these maps are obviously racially motivated. How can one accidentally make such a large statistical mistake? The 2020 elections show that the Republican Party is losing its grip on the Latino vote here in Texas, which they’ve historically had hooked. In response, the Republican vote has been locked back into power. With these new maps, Trump would have had one 65% of congressional districts instead of his actual 52.%), by drawing both Hispanic and diverse suburban areas together with large tracts of white, rural land. A district in the Rio Grande Valley, whose large Hispanic population historically favors blue candidates, was lumped with a nearby white, Republican area to make the district favor Republicans.
To secure the G.O.P. power in the state, Republican congressmen have resorted to diluting the brown vote, and that is plain to see. You can’t claim you’re drawing “color blind” maps if they are in fact representative of a chosen color– or party.